Updated on April 5, 2023
It’s easy to assume why or why not your cold email campaign is performing bad, but can you prove it?
One of the reasons why so many cold email campaigns fail is due to the lack of a system for measuring the progress and optimizing it based on the insights gathered.
If you want to start tracking the success of your email campaigns, the first step is understanding the email metrics you should be measuring and how they all play with one another.
This guide aims to help you with that.
We’ll show you how to calculate them, how they interact with each other, and how to improve the email metrics that affect the success of your cold email outreach campaigns.
Email Metrics you should be measuring
There are various email metrics used by email marketers and SDRs to reveal the effectiveness of their cold email outreach campaigns and company newsletters. By understanding how those email metrics influence your campaign, you’ll have a better comprehension of their importance and the story they tell.
There are different types of metrics for different purposes: metrics connected to email delivery & campaign delivery challenges, others are email engagement metrics, like open, click-through rate, and then we have overall email program metrics, such as revenue per email and list growth.
Let’s dive in.
Table of contents:
Email Delivery metrics
Campaign Delivery Challenges
Email Engagement Metrics
Overall Email Program Metrics
Email Delivery metrics
When it comes to email delivery & deliverability, planning is crucial. The truth is that no one is immune from delivery failures. With email service providers constantly updating their algorithms to combat spam, you’re going to be caught in their web sooner or later.
16% of all emails never make it into the inbox.
You may, however, mitigate the harm by closely monitoring your email delivery rates and focusing on the important parameters that will alert you to any concerns.
Therefore, the first two email metrics we have on our plate are:
- Email Delivery Rate (delivered emails)
- Email Deliverability Rate (inbox placement)
Email Delivery rate /or Delivered emails
An email counts as delivered if it did not bounce (or couldn’t be delivered).
The number of delivered emails is the total number of emails sent minus the number of emails that bounced. So email delivery rate is the percentage of the number of emails delivered divided by the total number of emails sent.
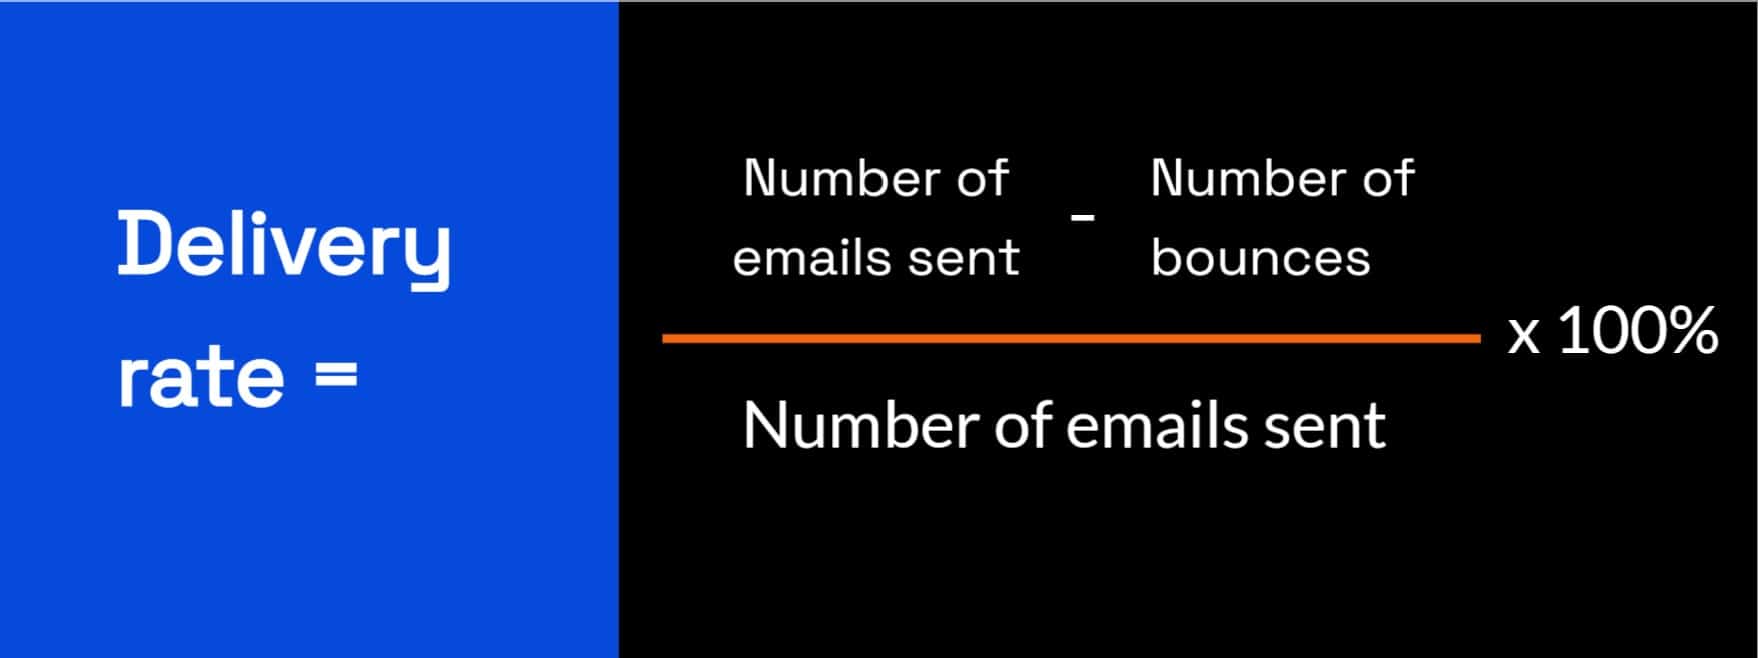
In other words, your email delivery rate is the ratio of emails sent that were delivered to at least one of the recipients’ email inboxes, such as their primary inbox, social, promotions, forums, or even the spam folder.

The primary objective of the delivery rate metrics is to show you that your emails didn’t bounce. Meaning = you have clean data in your email database. Which is great because outdated or bad data (invalid email addresses) may harm your sender’s reputation and result in a low sender score.
While the email delivery rate doesn’t guarantee the email was delivered to the primary inbox, it does indicate that it was neither rejected nor deferred by the email service providers (ESP).
But even if your delivery rate looks good it’s still possible that your emails never make it to the primary inbox of your recipients. They might have been redirected to the spam or junk folder.
So even with an amazing delivery rate, you can still have deliverability issues.
What’s deliverability then?
Email Deliverability rate /or Inbox placement rate
Email deliverability rate shows you where your email lands in your recipient’s inbox after it has been delivered.
Deliverability rate or Inbox Placement Rate (IPR) gives you the percentage of emails that were delivered to the recipient’s primary inbox rather than the spam or other inbox placements.
It depends on your email domain’s setup, authentication, and sender reputation—so if anything goes wrong, it’s not the invalid email addresses of your recipients, but something on your part.
You can see where your emails are being delivered at Gmail, Outlook, & all major ISPs and test your email deliverability with a tool like Glock Apps.
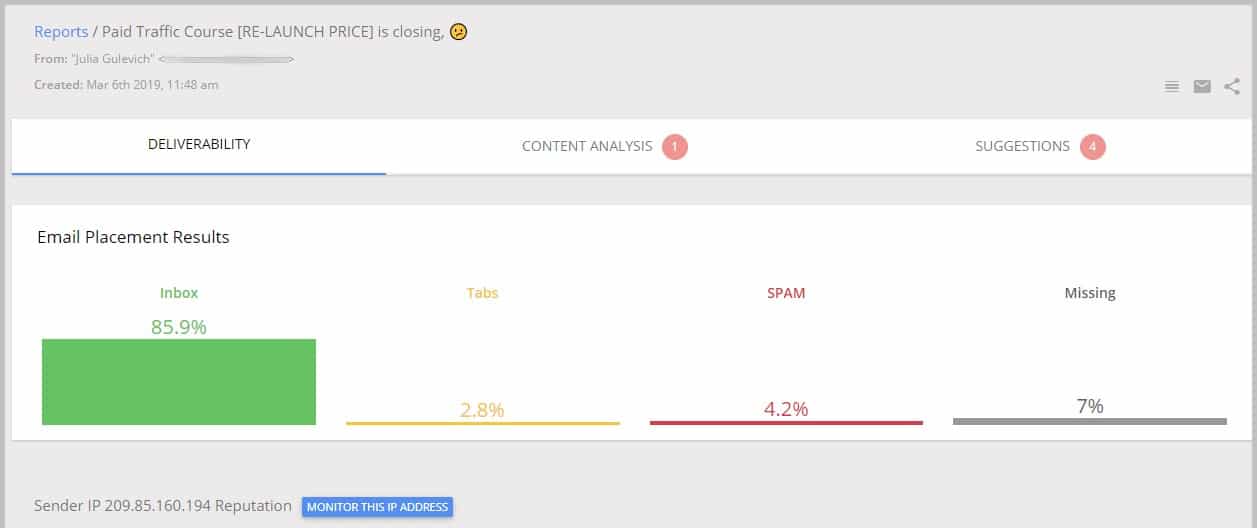
If you experience a low email delivery rate, analyze where and when it occurred. Check whether the problem is isolated to one campaign or one ESP and make necessary adjustments.
Here’s a helpful article on that subject.
Related read: How To Do an Email Deliverability Audit
Campaign Delivery Challenges
Once your email makes it through the servers and past the ESP filters, it will be delivered. But there are still some challenges that can occur, including:
- Hard & Soft Bounces
- Spam Complaints
- Spam Traps
- Sending Volumes
- Email Engagement
Email Bounce Rate
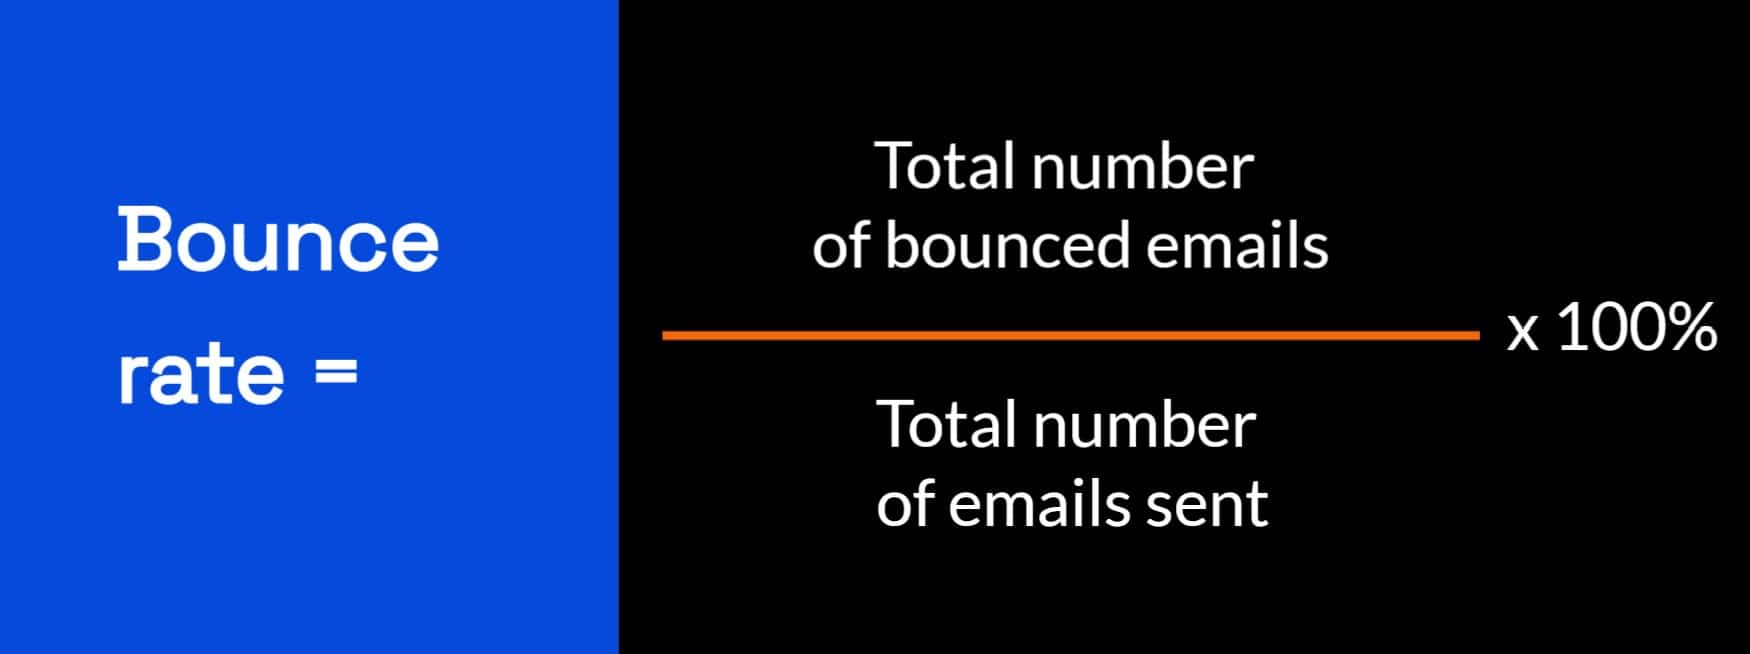
Bounce rate is the percentage of emails sent that bounced, meaning they could not be delivered. To calculate that, take the total number of bounced emails, divide it by the total number of emails sent and multiply it by 100 to get the percentage.
There are two types of bounce: hard and soft.
A hard bounce means there are permanent reasons why the email wasn’t delivered. Some of the reasons are:
- The recipient’s email address doesn’t exist.
- Or the recipient’s email server has completely blocked delivery.
And there’s nothing you can do about a hard bounce, really.
A soft bounce is experienced when there is a temporary issue affecting the email’s delivery. The email server cannot deliver your message, but it is still trying and will continue to try for a limited period of time.
Soft bounces usually occur when the email was delivered but later bounced back after checking to see if the email actually exists. Reasons?
- The recipient’s mailbox is full;
- The mail server is temporarily unavailable;
- The message is too large;
- The domain name does not exist…
Among others.
You can try to rectify soft bounces by sending the email again when the mailbox may have freed some space; giving it a few hours until the server is likely up and running again; or finally, reducing the size of your message.
What is a good bounce rate?
As a general rule of thumb, your bounce rate should be under 3%. Most email service providers will penalize you if your bounce rate exceeds 5%, which will affect your ability to run future email campaigns.
In 2020, the average bounce rate for B2B emails was 1.2.%.
Common causes of high bounce rates (to avoid)
1. Your import might have formatting errors
Before you import contacts into your cold email outreach tool, check the CSV files for formatting problems to avoid adding/duplicating unnecessary information to crucial fields in your lead list. Hard bounces can be caused by formatting mistakes in the email address field.
2. Using a free email service for your “From” email address
Certain email providers have updated their DMARC regulations in an effort to combat bogus emails. If you use a free email provider for your From email address, such as Yahoo or Gmail, DMARC authentication will fail, causing emails sent to receiving servers that check for DMARC to bounce. We highly advise that you use an email address from a private domain, such as the one you use for business or your website.
3. Your lead lists are outdated or contain bad data
If you see high bounce rates your lead lists (or subscribers database) may include stale or inactive addresses. Stale email addresses are either invalid or belong to contacts who subscribed to receive communication from you a long time ago and haven’t been emailed to on a regular basis. Or there might be a problem with where your prospects’ email addresses came from or how they were compiled.
Related read: How to Improve Your Email Bounce Rate
Spam Complaints
Spam complaints are reports made manually by your email recipients against emails they don’t want in their inbox. So, apart from the spam filters that email providers have in check, the people in your lead list can mark you as a spammer themselves.
These complaints can harm your sender’s reputation and deliverability rate, or even get you blocked by ESPs, and then even people who do want to hear from you may not.
Most ESPs include a “Report Spam” button to allow their clients to report unwanted emails. Here’s an example “spam” button in Gmail:
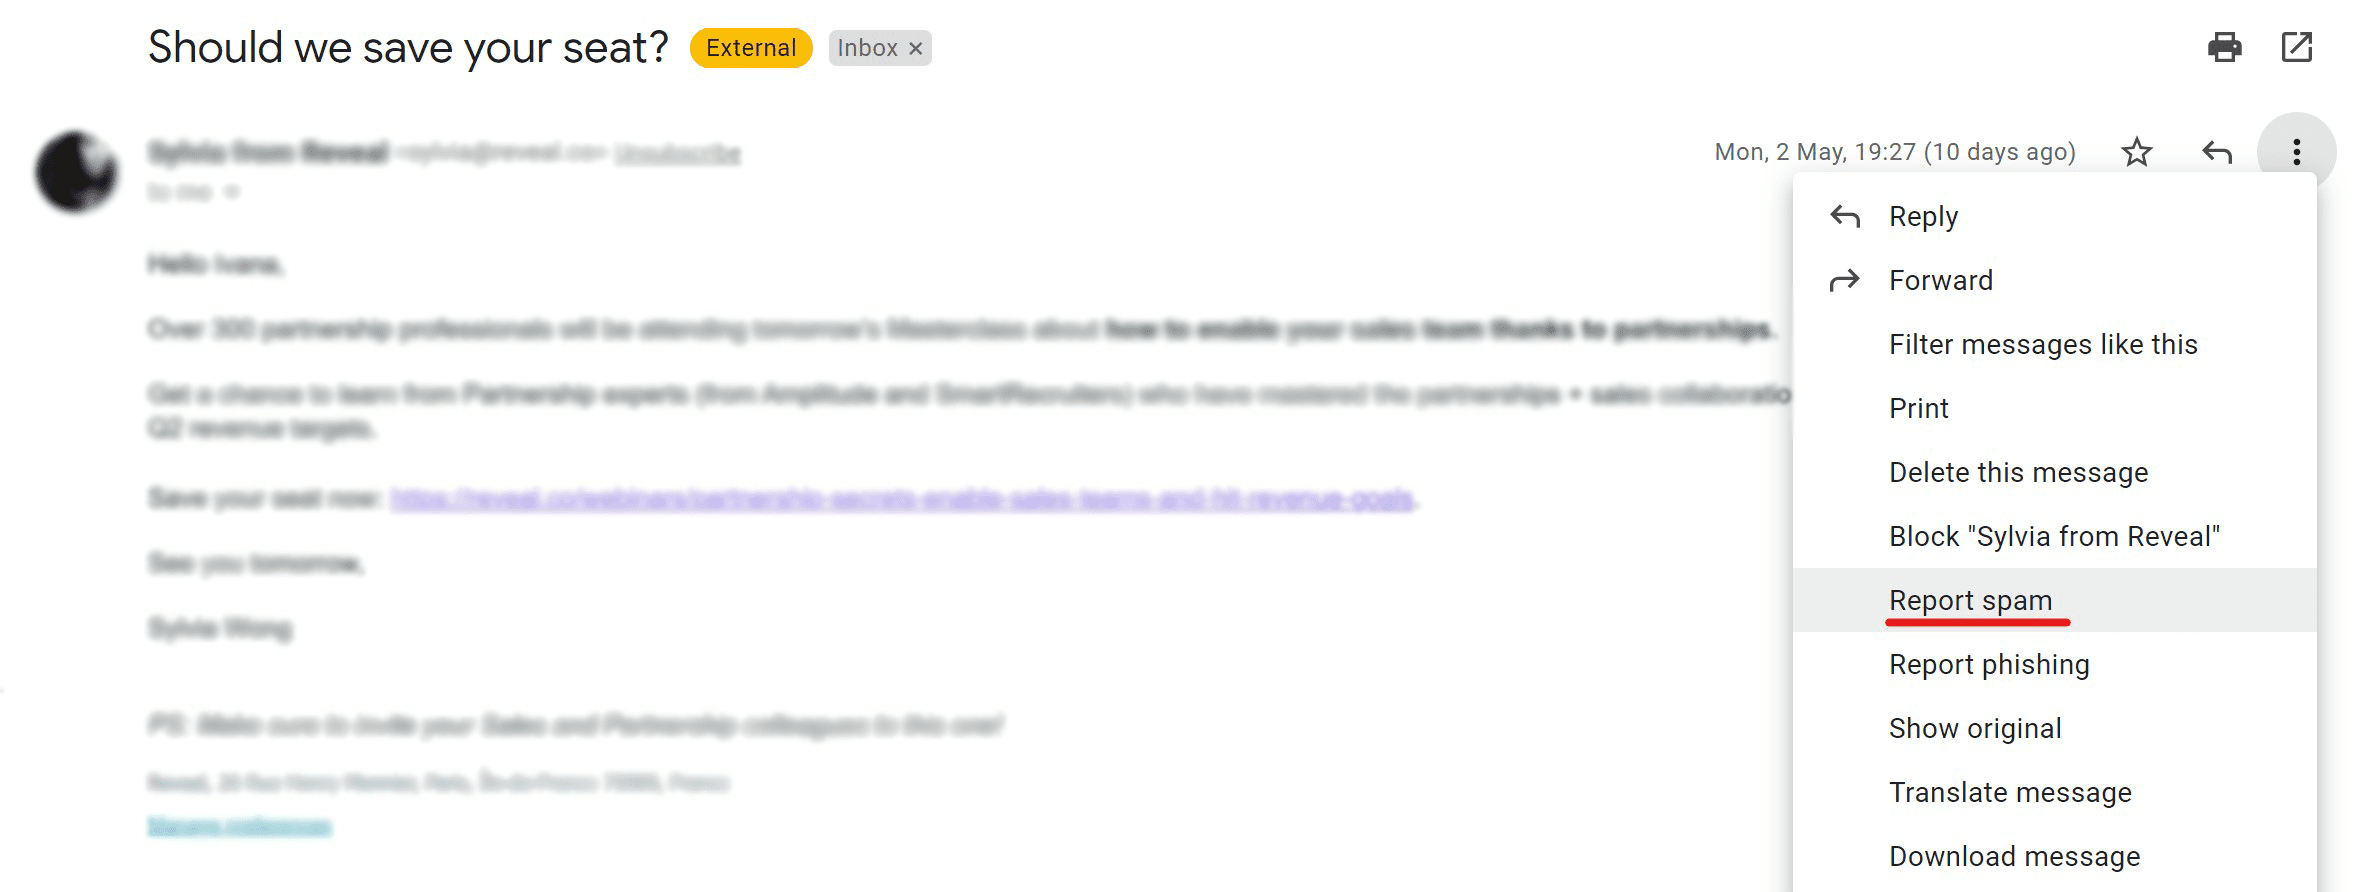
This usually happens when people have no other alternative to stop you from sending them emails they’re not interested in receiving or never opted-in to receive communication from your brand.
We calculate the spam complaint rate as the number of people who reported email as spam out of the total number of email messages you have sent. For example, if you send 2,000 messages and 2 people mark it as spam, your spam rate is 0.1%.
Which is the industry-accepted standard spam complaint rate. Having less than 0.1%, or 1 complaint for every 1,000 sent messages is OK.
How to reduce a high spam complaint rate?
#1. Set up a custom domain, so the domain used in your tracking links matches the one in your ‘from’ address. 89% of all B2B email campaigns are sent from a company name.
#2. Never buy lead lists or subscriber lists, as these are not permission-based and can contain spam traps.
#3. Always include an unsubscribe button in a prominent position in the email, somewhere that can be easily found. And make the unsubscribing process as smooth as possible. Let them go. It is much better to have someone unsubscribe instead of marking you as spam. Unsubscribe won’t hurt your deliverability, but a spam complaint will.
#4. Enable double confirmation email (double opt-in) for subscribers or add captcha. This makes sure only valid addresses are added to your lists, not any bots or email addresses with irregularities.
#5. Only send to contacts who have explicitly opted in to receive business communication from you within the past 12 months. Or be extra careful when you’re cold-emailing prospects for the first time – you’ll need to introduce yourself and make sure each email is hyper-personalized for each recipient.
Spam Traps
Spam Traps are real email addresses that didn’t bounce but are being monitored by ESPs and blacklists. Often, ESPs will take over abandoned email addresses and turn them into spam traps. There are three different types:
- Typo – an email address with an ESP domain misspelled (ex: name@gnail.com, or homtail.com)
- Recycled – an email address that existed, was abandoned, and later reactivated by the ESP;
- Pristine – an email address that never opted into any email communication.
The thing is, spam trap addresses cannot opt-in to receive email. So the only way a spam trap address can end up on your list is if you’re not maintaining healthy lists or if you’re purchasing lead lists and not abiding by the rules of permission-based email marketing. And that’s how the email service providers will know if you do.
Sending Volume ⚠️
Another major challenge in optimizing cold email campaigns is the ‘sending volume’.
ESPs want to see an established sending history and sending pattern from your email domain in order to help determine inbox placement. Spikes in email volumes will often trigger their spam filters due to inconsistency with your existing sending pattern.
e.g. Let’s say you send a regular weekly cold email outreach to about 50 prospects.
Suddenly, you begin emailing more than 200 people per week!
This could trigger the ESP’s spam filter because it doesn’t align with your sending history. You must keep a regular sending pattern that doesn’t have large fluctuations with volume.
If that’s true for mature email domains, imagine how strict they are with a new email address with 0 sending history. And we know that every new hire in your sales team means a new email address for cold email outreach – including bulk emailing.
Going from 0 to sending 100 emails per week activates the spam filters and puts at danger the sender’s reputation of your entire company’s email domain! Because their new email address will use your company’s email domain, for example, newhirename@yourcompany.com.
How to optimize your Sending Volume?
Increasing your sending volume manually, by sending more and more emails per day for a continuous period of time can be quite exhausting. And it can take your time and energy away from more important tasks at hand.
Luckily, there are tools to help you with that.
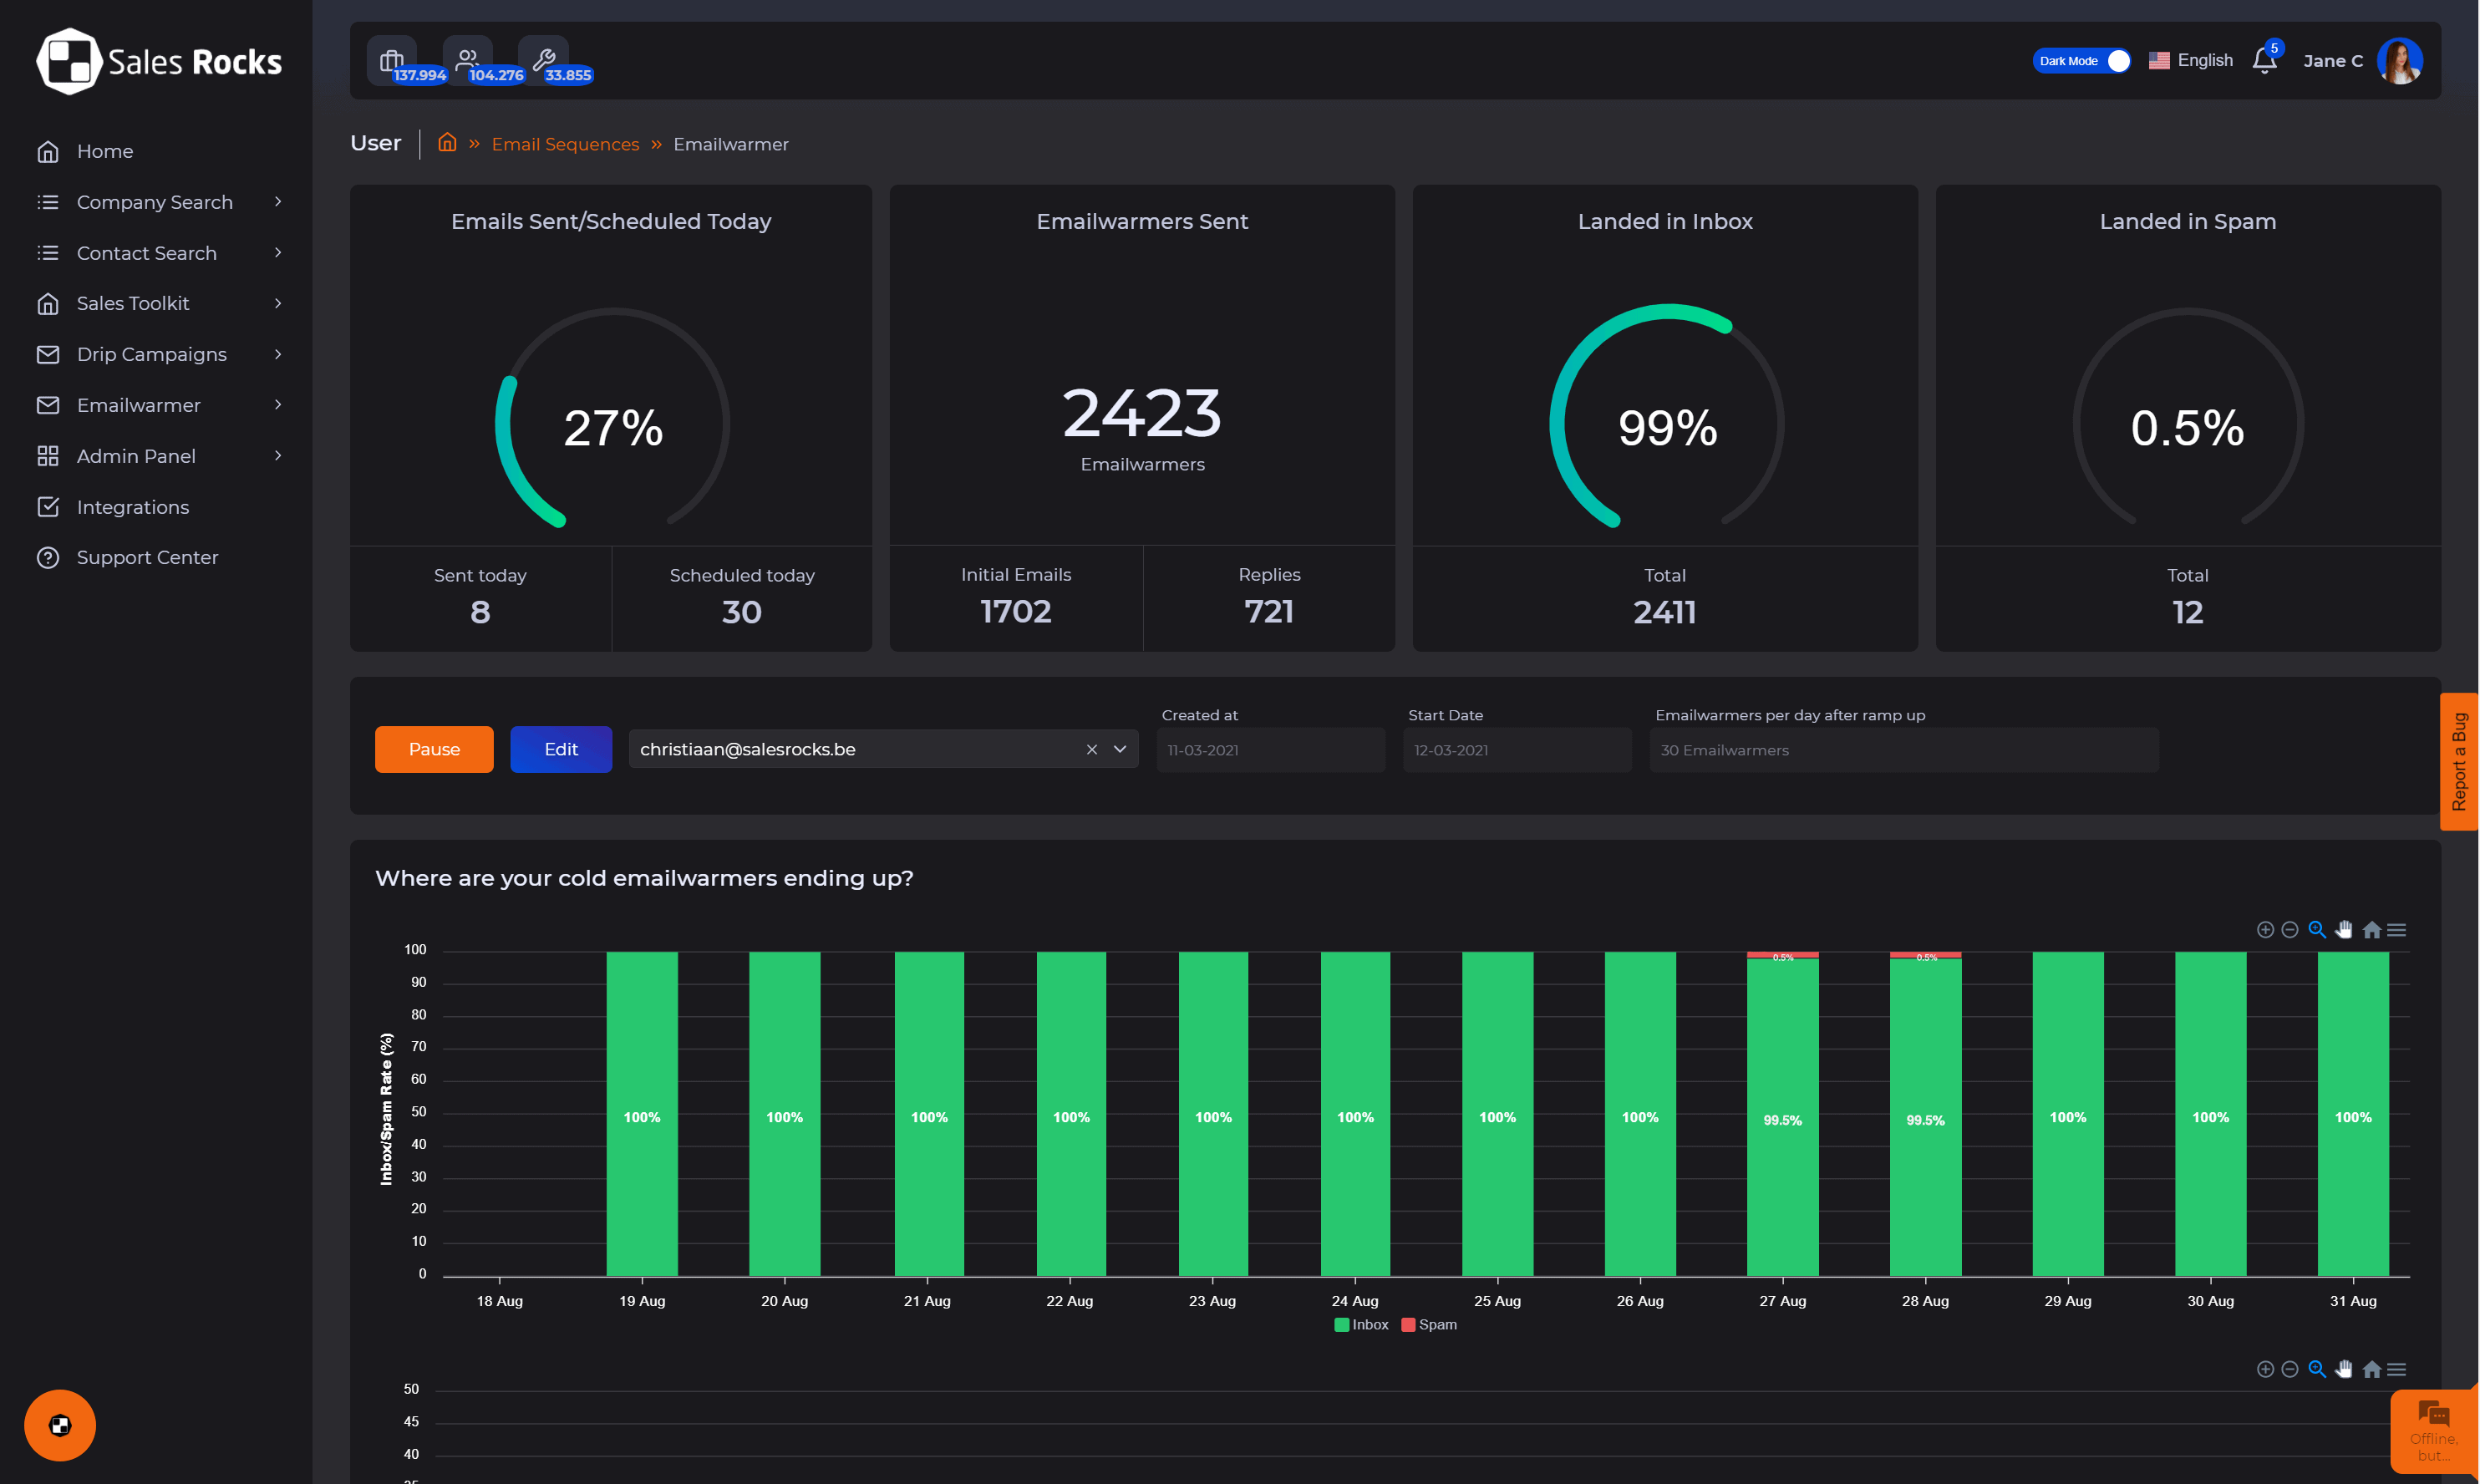
Sales.Rocks ‘Email Warmer‘ for example, will warm up your new email accounts or boost the sending volume of more mature ones – on automation.
Read more on the subject here: Do an Email Warm Up Before You Start Sending Out Cold Emails
Email Engagement
Certain ESPs look at the engagement of the recipient to determine inbox versus junk folder deliverability. These types of engagement include open, click, save, reply, forward, move, etc.
The more engaged a recipient is, the greater the chance of the email landing in the inbox because ESPs monitor the sender’s IP and domain reputation, along with user engagement, to score the sender.
This is another realm in your cold email campaign that you can optimize with an email warming process.
Now that we went through all the email deliverability metrics and campaign delivery challenges, you know what aspects you need to cover so you can make sure that every email you send is delivered to the right inbox of each recipient.
Email Engagement Metrics
Time to move on to the next group of metrics – the email engagement metrics, that you need to measure and analyze after your emails are successfully delivered into the inbox. Their purpose is to guide you to optimize your cold email campaign for better engagement with your recipients and ultimately, turn them into satisfied customers.
- Unsubscribe Rate
- Cold Email Open Rate
- Click-Through Rate (CTR)
- Email Conversion Rate
Unsubscribe rate
Let’s start with the one thing we strive to avoid at any cost. The unsubscribe rate.
The unsubscribe rate is the percentage of people who opted out of your mailing list after an email campaign. It tells you the number of subscribers/prospects who have chosen not to any other type of email communication from you any further.
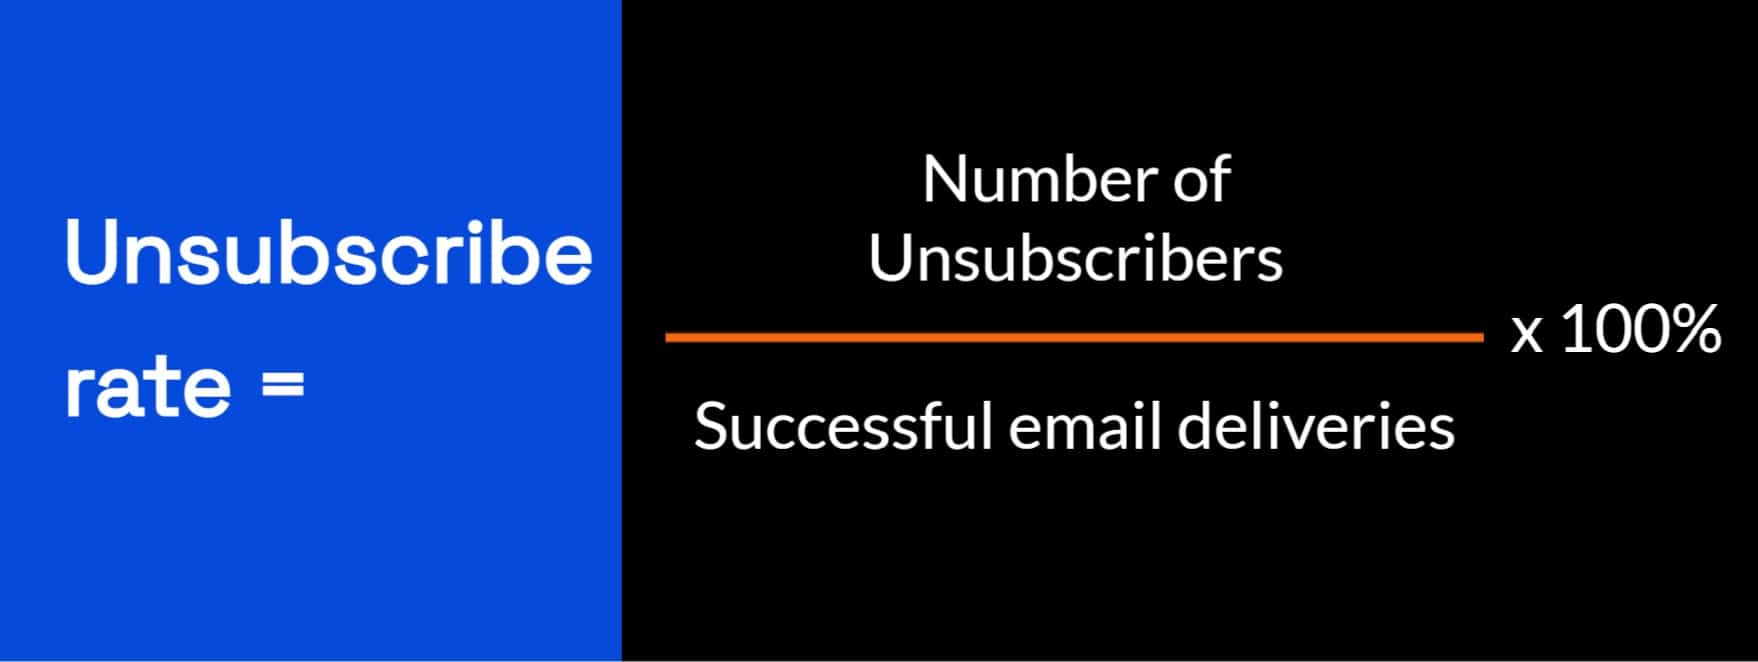
The unsubscribe rate is calculated by dividing the total number of email unsubscribes by the total number of people who received the message.
The average unsubscribe rate is 0.49%. But the sector with the highest average unsubscribe rate is B2B (non-retail) is displaying at 1.08%. I guess all of us in the B2B industry will have to work extra hard to improve this situation.
Here’s what you can do to Reduce Email Unsubscribes
1. Segment your lead list better.
Lead segmentation is the process of dividing the leads on your list into smaller groups, depending on their mutual characteristics. Also, one of the best ways to optimize your cold email campaign.
Companies that used segmented campaigns noted as much as a 760% increase in revenue. Because segmented email campaigns show 50% higher CTR than untargeted campaigns.
In the B2B industry, we are huge fans of firmographic segmentation and when it comes to SaaS, we segment leads additionally according to technographics. These two types of email segmentation are so important because it allows you to deliver only the most relevant, customized content to each B2B lead. The more specific your segments get, the better able you are to deliver content that speaks directly to their interests.
Coming from Hubspot: If you’ve implemented a lead nurturing campaign, you can continue to collect information about your leads on their on-site and off-site behavior allowing you to understand their needs and then deliver more personalized emails aligned with their stage in the buying cycle.
Related read: How Important is Lead List Segmentation and How Best to Do It
2. Embrace the art of email personalization
The top 3 reasons for using personalization in email marketing are improved open rate (82%), higher CTR (75%), and better customer satisfaction (58%).
Personalization in cold email campaigns has a significant impact on sales. And has the power to reduce your unsubscribe rate while improving your response rate. However, there is no personalization without segmentation. They’re mutually inclusive. Dividing your lead list into meaningful segments and creating a separate template for each segment, that speaks to their common interests or needs, is the easiest way to personalize and optimize your cold email campaign.
To achieve this you’ll need business information on every lead or prospect on your list. Including crucial information about their company. For both, segmentation and personalization.
B2B Data will tell you
- What’s their annual revenue? – so you know if they can afford your service;
- What’s the tech stack they’re already using? – to know if it plays well with your SaaS;
- Their job title? To create one template that addresses pain points related to their work;
- Their contact details – email and LinkedIn account, phone number;
- Their place in the company’s hierarchy, so you know who’re the decision-makers, etc.
All this info makes your cold email campaign much more relevant, personalized, and not so cold anymore. And the best part is, you can get this info from a B2B data provider! Or try to find and collect the info manually (your sales reps’ worst nightmare).
Besides that, your B2B marketing team can collect and leverage extra information on user interactions with your website and emails, their current position in the sales funnel, etc., and use the collected data to optimize their overall experience.
Related read: The Power of Hyper-Personalization in Email Marketing
3. Use a Combination of Double Opt-ins and Single Opt-ins
The CAN-SPAM Act requires businesses to opt-in users. Single opt-ins are easier for the user and the fastest way to build a list, but they have certain shortcomings.
Double opt-in makes sure that you deal with an engaged audience and have active and clean email addresses on your mailing list. If you’re interested to learn their difference and how to combine them, read this article next.
Related read: Getting Email Subscribers: Is Single Opt-in or Double Opt-in better?
4. Email Sending Frequency (let them decide)
There’s no strict rule for email frequency. Too few and you may be forgotten, too many and you suddenly end up with a high unsubscribe rate.
According to Databox, 33.3% of business professionals send email campaigns on a weekly basis, 26.67% – multiple times per month, and 13.33% each – multiple times per week, daily, and monthly. At the same time, two-thirds of specialists said they reduce the email frequency if the recipients do not engage.
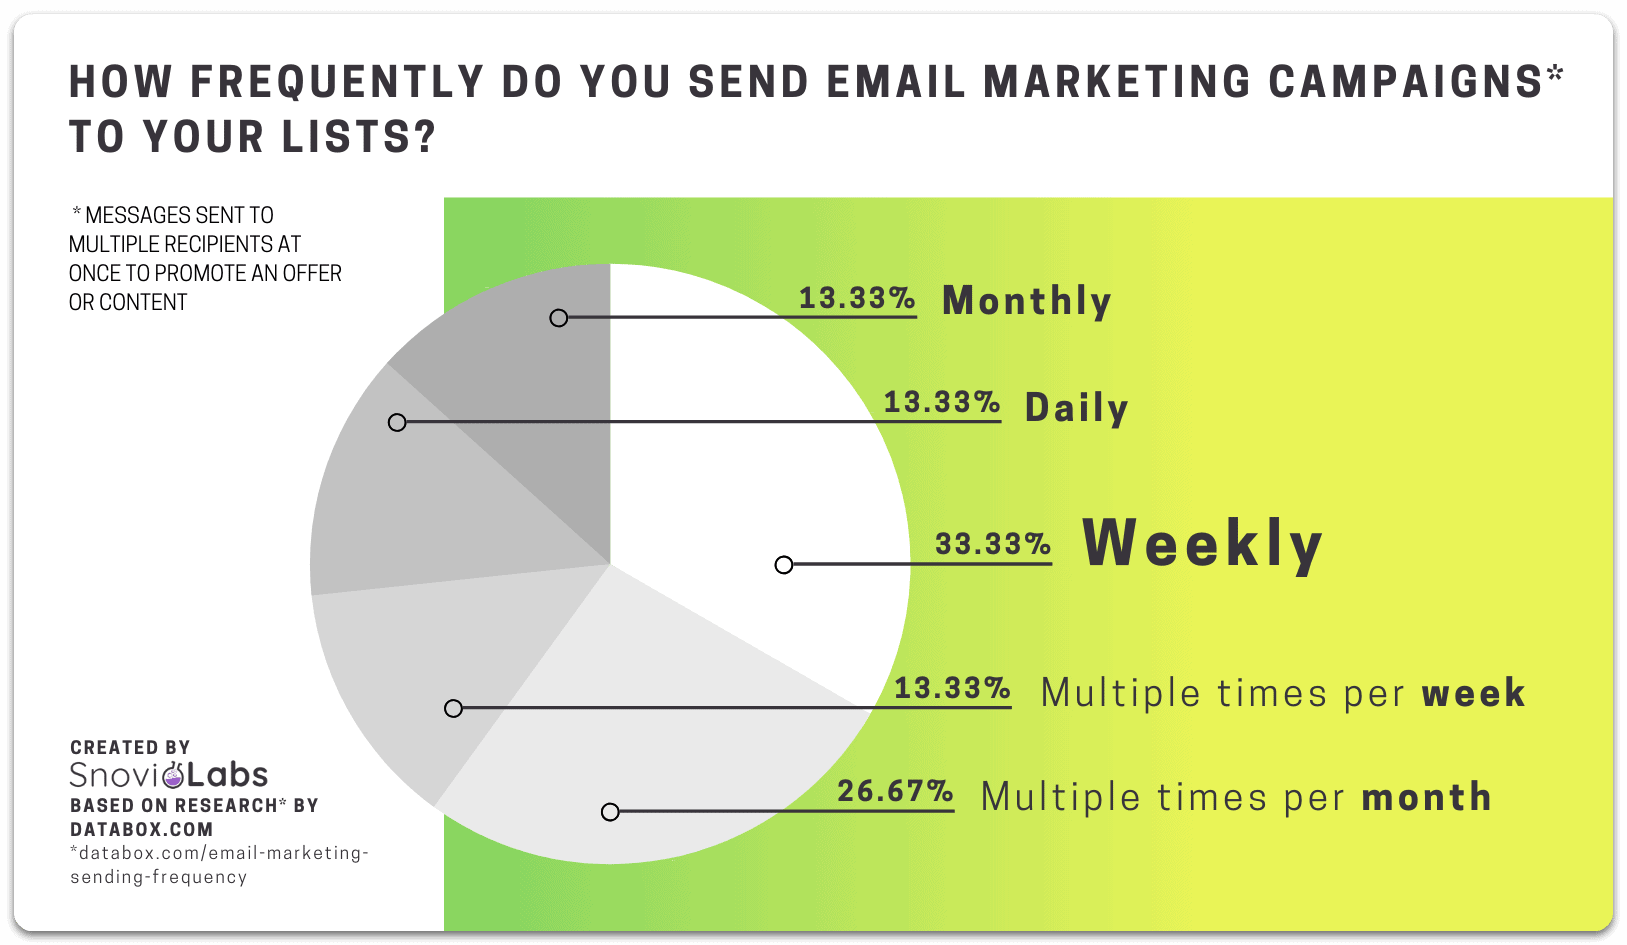
Source: Snov.io
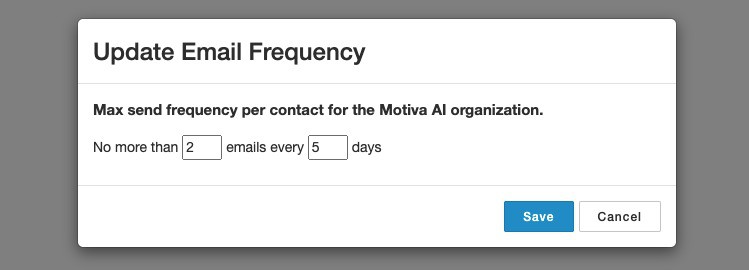
When it comes to the email sending frequency in the B2B realm, we let our users decide. Give them a choice on the number of emails they want to receive from you at the beginning of your relationship — in the subscription confirmation email.
Once per week or once per month? It’s up to them.
Cold Email Open Rate
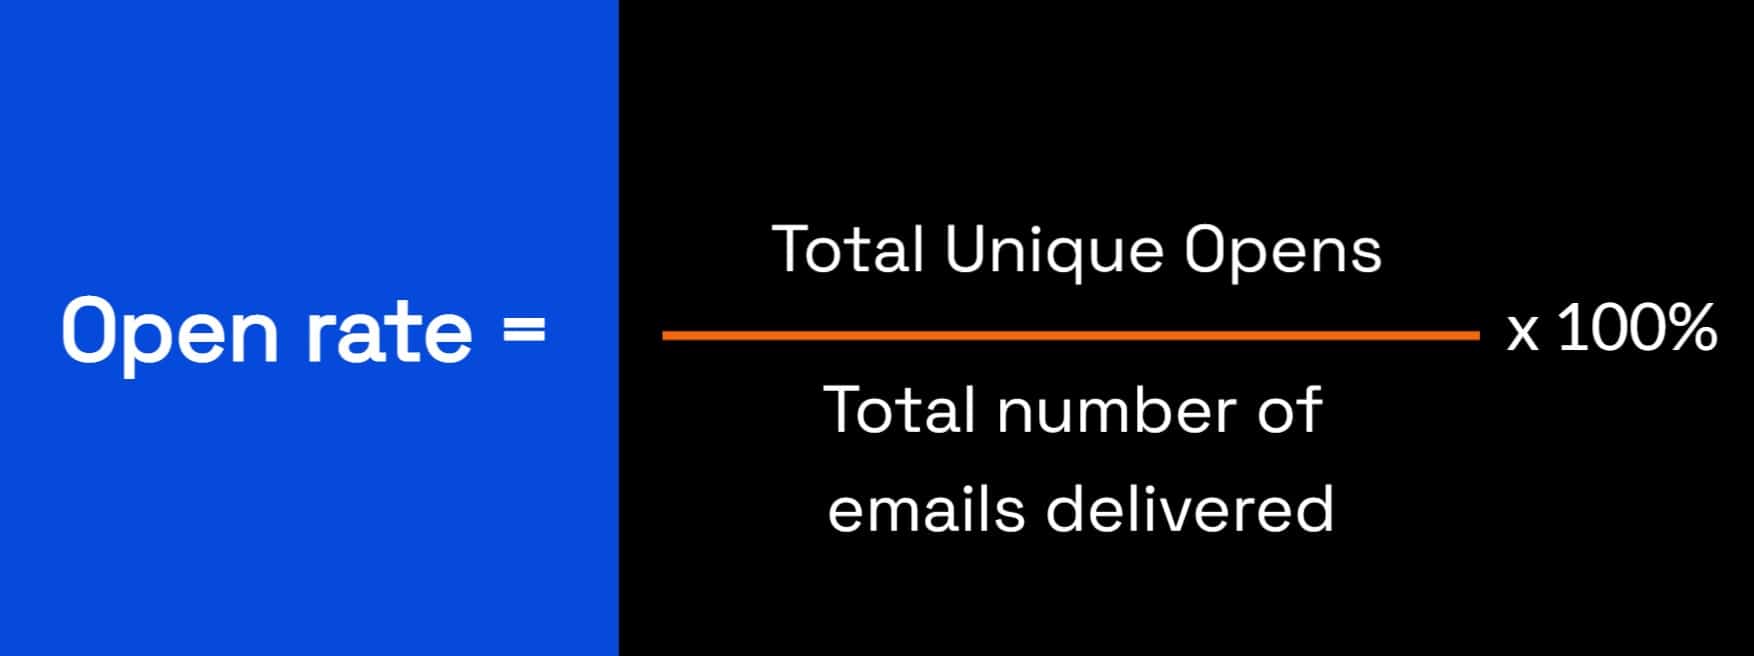
Email open rate is the percentage of people who received your email and then opened it. It is calculated by dividing the total number of emails that were opened by the number of emails that were delivered.
The average cold email open rate varies by industry, and the general average in 2019 was around 22.15%
According to the 2018 DMA benchmark report, the average B2B email open rate was 15.1%.
Although important, the open rate can be a vanity metric if it is inflated by spam/antivirus checks.
Is email open rate a vanity metric?
The email open rate metric relies on a tiny image pix inside the email that’s being downloaded (and activates the “email opened” alarm) when the person is reading the email. This is the only way that has been figured out how to track “email opens”, and all email service providers use this method.
But… changes in technology are making it more difficult to get reliable open rate data.
A few years ago Outlook, Gmail, and Yahoo started blocking those images in email. Also, many mobile devices (e.g. Blackberry) render the email in text format by default. No images are downloaded in this format, so if a prospect reads your email on a Blackberry, it won’t be counted in your open rate.
The cold email outreach software you use shouldn’t count open rates from antivirus or the mail software itself. There are some software solutions that screen these via the IP address when the image pixel is loaded.
Also, check the timestamps of the open rates and see whether they really make sense. The system can be ignoring opens within the first 30 seconds. If you make a report of your open activity, you should be getting insights into this data.
Email Click-Through Rate
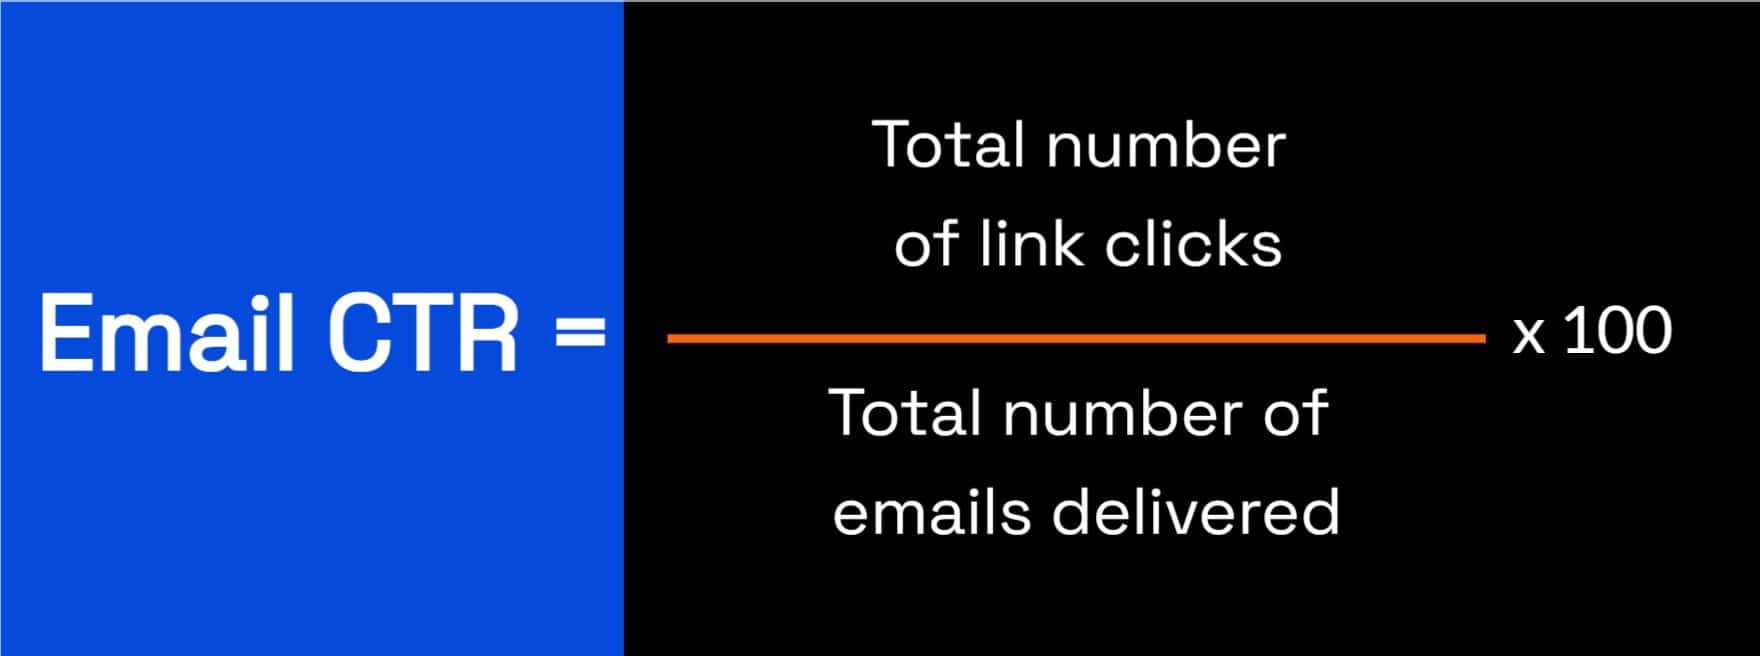
Your click-through rate, (CTR), is the percentage of recipients who clicked on one or more links within your email. The clickthrough rate is calculated by dividing the total number of link clicks by the total number of emails successfully delivered.
Another variation of the click-through rate is the click-to-open rate (CTOR) in which the total number of clicks is divided by the total number of emails opened rather than delivered.
A good click-through rate should be between 2-5%, and a good CTOR should fall between 6-17%, again, depending on the industry you’re in.
Tips to help improve your click-through rate:
- Create data-driven segments so you always send the most relevant content;
Relevant content is the #1 reason why anybody clicks on a link. - Include a personalized email opening line. Invite them to read further;
- Ensure your subject line accurately reflects the content of your emails;
- Refresh your cold B2B templates regularly;
- Improve your CTAs with clear copy and test colors and design;
- A/B test what works.
Related read: How to Track Email Link Clicks in Your Cold Email Outreach
Email Conversion Rate
This is the percentage of people who received your email and went on to complete your call-to-action, whether creating an account, filling out a form, or replying. The conversion rate is calculated by dividing the total number of emails delivered by the total number of completed calls to action from the email campaign.
Common conversions associated with email campaigns include registration or filling in a lead form, making a phone call or phone inquiry, booking a demo or appointment, or subscribing to your software solution.

If we take a look, at Sales.Rocks as an example of providing reporting, the report dashboard allows you to analyze campaign performance, specifically by providing information about recipients, messages delivered, open rate, clickthrough rate, bounce rate as well as unsubscribed rate.
In addition to the email process metrics, which are calculated for almost every cold email campaign you send, you will also want to measure these important overall email program metrics.
Overall Email Program Metrics
In addition to the email process metrics, which are calculated for almost every cold email campaign you send, you will also want to measure these important overall email program metrics.
- Email List Growth
- Revenue per Email
List growth
This email metric will be important for the B2B email marketer.
When you’re getting email subscribers to sign up for receiving your company’s newsletter or new blog articles, it’s important to keep an eye on your list growth and hygiene.
While it’s a relatively simple metric, it’s important to measure list growth because people are always joining as well as leaving your email list and you will want to make sure your list growth is at least net positive. Obviously, the more subscribers you have, the larger your target audience to nurture and market to. With that comes the potential for more revenue and customers from your email channel. To calculate list growth, just count the number of new subscribers you receive per week, month, or year.
Revenue per email
Knowing how much revenue on average an email recipient generates over the course of a cold email campaign or over a period of time, like a month, quarter, or year – is vital to understanding the value of your email database and lead lists.
To calculate revenue per email sent, divide all revenue generated by a cold email campaign by the number of customers who subscribed to your service from that campaign.
Or, to calculate revenue per email recipient over, say, an entire year, you can divide the total revenue generated by your cold email outreach efforts by the number of contacted leads on your email list.
This email metric may be more difficult to calculate if your email campaigns don’t directly generate sales, but if they do and you can find a way to calculate it, definitely do.
Optimizing Email Campaigns Performance (to sum up)
Optimizing is the process of continually improving certain elements of your email campaigns. Here are some general ways in which you can optimize any email campaign performance and click-through rates:
- Use simple and explicit CTAs.
- One main CTA per email campaign.
- Segmentation & Personalization.
- A/B Testing.
Don’t forget to optimize for mobile!
Be mindful of how people will engage with your email campaigns on a mobile device.
- Identify the ways to optimize email for mobile:
- Keep the flow of mobile all the way to the landing page.
- Make images and emails lightweight for mobile devices.
- Code for phone, tablet, and desktop.
Minimizing Bounces and Unsubscribes
In order to minimize the number of undesirable reactions to your email campaigns, like bounces and unsubscribes, it’s important to create relevant content that aligns with subscriber expectations.
Always ask yourself, are you sending content that is in sync with what your recipient signed up for?
Does your subject line match the content in your email? Does your email cadence and frequency resonate with what your recipients signed up for and are expecting?
It’s essential to monitor your email campaign reports for multiple reasons. Certainly, to review process metrics, like opens and clicks, and spot any dips or spikes. To determine unsubscribes and reasons for complaints. To understand what drives or inhibits campaign conversions and sales.
And of course, to monitor for deliverability issues, including bounce problems or list hygiene. Make sure you’re sending emails to the right recipients. Identity people who are disengaged and reduce or stop communicating with them.
From B2B Data
to Cold Email Outreach
Deliver Email Perfection with Sales.Rocks


